Asset Turnover Ratio: Formula, Example & How to Interpret It
A simple efficiency ratio that tells you how much revenue every dollar of assets actually produces — and why keeping equipment running is one of the best ways to improve it.
What Is the Asset Turnover Ratio?
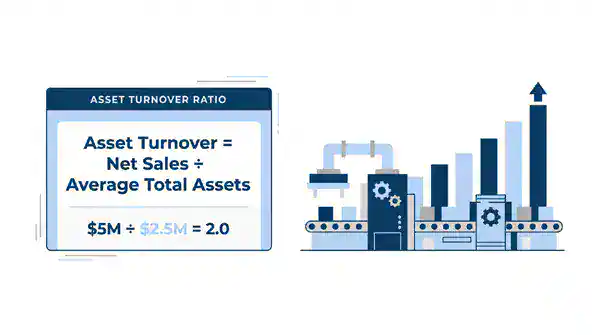
The asset turnover ratio measures how efficiently a company uses its total assets to generate sales. It is calculated by dividing net sales by average total assets, and the result tells you how many dollars of revenue each dollar of assets produces over a period. A ratio of 2.0, for example, means the business generated $2 in sales for every $1 of assets it held.
Because it ties the top line of the income statement to the asset base on the balance sheet, the ratio is a core efficiency (or activity) metric. A higher number generally signals that assets are being put to productive use; a lower number suggests capital is tied up in assets that are not pulling their weight. It is most useful when tracked over time and compared against companies in the same industry, since what counts as “good” varies enormously from one sector to the next.
The Asset Turnover Formula (With a Worked Example)
The formula for asset turnover is net sales divided by average total assets:
Asset Turnover Ratio = Net Sales ÷ Average Total Assets
where Average Total Assets = (Beginning Total Assets + Ending Total Assets) ÷ 2
Use net sales (gross sales minus returns, allowances, and discounts) from the income statement, and average total assets from the balance sheet. Averaging the beginning and ending asset balances matters: sales accumulate across the whole period, so pairing them with a single point-in-time asset figure would distort the result. Here is a worked example for a full fiscal year:
| Input | Value |
|---|---|
| Net sales (for the year) | $5,000,000 |
| Total assets — start of year | $2,200,000 |
| Total assets — end of year | $2,800,000 |
| Average total assets | ($2,200,000 + $2,800,000) ÷ 2 = $2,500,000 |
| Asset turnover ratio | $5,000,000 ÷ $2,500,000 = 2.0 |
The result of 2.0 means this company generated $2.00 in sales for every $1.00 of assets during the year. On its own the number is just a data point — its value comes from the comparison you make next.
How to Interpret a High vs. Low Ratio
A higher asset turnover ratio usually means a company is generating more sales from its asset base, while a lower ratio means assets are generating less revenue relative to their value. But “high” and “low” only have meaning inside an industry, because asset intensity differs so sharply between sectors.
Asset-light businesses such as retailers and grocers typically post high ratios — they move large sales volumes on comparatively modest assets. Capital-intensive businesses such as utilities, telecom, and heavy manufacturing carry enormous plant and equipment on the balance sheet, so even healthy operators show low ratios. Comparing a utility to a retailer on this metric tells you nothing useful.
| Industry type | Typical ratio range | Why |
|---|---|---|
| Retail & grocery | High (≈ 2.0–4.0+) | Low asset base, high sales throughput |
| Consumer services | Moderate–high (≈ 1.0–2.5) | Limited fixed assets relative to revenue |
| Manufacturing | Moderate (≈ 0.5–1.5) | Significant plant, equipment, and inventory |
| Utilities & telecom | Low (≈ 0.25–0.5) | Very large, long-lived capital assets |
The ranges above are general tendencies, not fixed benchmarks. The two comparisons that actually matter are trend (is your ratio rising or falling year over year?) and peers (how do you stack up against direct competitors with a similar asset profile?). A rising ratio suggests assets are being used more productively; a falling ratio can flag over-investment in assets, declining sales, or idle capacity.
The Fixed-Asset Turnover Variant
Fixed-asset turnover is a narrower version of the ratio that measures sales generated specifically by a company’s fixed assets, or property, plant, and equipment (PP&E). Instead of dividing net sales by total assets, you divide by average net fixed assets:
Fixed-Asset Turnover = Net Sales ÷ Average Net Fixed Assets (PP&E)
Continuing the example above, if the company’s average net PP&E were $1,250,000, its fixed-asset turnover would be $5,000,000 ÷ $1,250,000 = 4.0. This variant is especially relevant to asset-heavy operations — manufacturing plants, fleets, and facilities — because it isolates how hard the physical equipment is working, stripping out cash, receivables, and other current assets. It is the version maintenance and operations leaders should watch most closely, since it responds directly to how well machines, vehicles, and building systems are kept running and utilized.
Limitations to Keep in Mind
The asset turnover ratio is a useful efficiency gauge, but it is not a profitability measure and it carries several blind spots. Read it alongside other metrics rather than in isolation.
- It ignores profitability. High turnover on thin margins can still mean a struggling business. Pair it with margin and return measures such as return on assets.
- It is industry-bound. The number is only meaningful against peers with a similar asset structure; cross-industry comparisons mislead.
- Depreciation skews it. Older, heavily depreciated assets shrink the denominator and can inflate the ratio, making an aging operation look more efficient than a competitor that recently reinvested.
- Timing and seasonality distort it. A large asset purchase or a seasonal sales swing late in the period can move the ratio without reflecting a real change in efficiency.
- It says nothing about asset condition. A high ratio can mask deferred maintenance and under-investment — assets being run hard without being cared for, which eventually shows up as downtime.
How to Improve Your Asset Turnover Ratio
There are two ways to raise the ratio: generate more sales from the same assets, or carry fewer assets for the same sales. For maintenance and operations teams, most of the levers are on the equipment side:
- Cut unplanned downtime. Every hour a machine sits broken is an hour it adds nothing to sales. Preventive maintenance and faster repairs keep the existing asset base producing.
- Raise utilization before buying more. Check whether current equipment is running at capacity before adding new assets. Better scheduling often frees up capacity that’s already paid for.
- Sell or retire idle assets. Equipment that rarely runs still counts in the denominator. Track which assets are underused and dispose of the ones you don’t need.
- Right-size spare parts inventory. Inventory is an asset too. Excess or obsolete spares inflate total assets without adding sales.
- Extend the useful life of what you own. Well-maintained equipment delays replacement purchases, so the asset base grows more slowly than the business.
- Track it with reliability metrics. Watch uptime, MTBF and MTTR, and run hours by asset so you can see which machines are holding the ratio back.
How Asset Maintenance Relates to Asset Utilization
Fixed-asset turnover rewards utilization, and utilization depends on uptime — which is largely a maintenance outcome. The ratio is a financial view of the same question maintenance teams work on every day: are our physical assets actually producing? An asset sitting idle because of an unplanned breakdown still sits in the denominator of the ratio but contributes nothing to the numerator.
That is the factual link between the balance sheet and the maintenance shop. Keeping equipment available and running at capacity through preventive and condition-based maintenance is what lets a given asset base generate more sales. Tracking the underlying asset data — run hours, downtime, condition, and work history — is a core function of asset management, and a CMMS is the system that captures it. Disciplines such as asset performance management and enterprise asset management extend that picture across the full asset lifecycle, connecting day-to-day maintenance decisions to how productively the asset base performs.
Get More From the Assets You Already Own
See how eWorkOrders helps your maintenance team schedule preventive maintenance, track inspections, and turn problems into work orders before small issues become costly downtime. See how it works in a free, personalized demo.
Frequently Asked Questions
What is the formula for asset turnover?
Asset turnover equals net sales divided by average total assets. Average total assets is the beginning balance plus the ending balance, divided by two. The result shows how many dollars of sales each dollar of assets generated over the period.
What is a good asset turnover ratio?
There is no universal “good” number — it depends on the industry. Asset-light retailers often exceed 2.0, while capital-intensive utilities may sit near 0.3. The most meaningful tests are whether your ratio is improving over time and how it compares to direct competitors with a similar asset base.
What is the difference between asset turnover and fixed-asset turnover?
Asset turnover divides net sales by average total assets, covering the entire asset base. Fixed-asset turnover divides net sales by average net fixed assets (property, plant, and equipment) only, isolating how efficiently a company’s physical equipment and facilities generate revenue.
How can you improve asset turnover ratio?
Increase sales from the same asset base or reduce the assets you carry. Practical steps include cutting unplanned downtime with preventive maintenance, raising utilization before buying new equipment, selling idle assets, right-sizing spare parts inventory, and extending equipment life through good maintenance.
Does a higher asset turnover ratio always mean better performance?
Not necessarily. A high ratio signals efficient use of assets but says nothing about profitability, and it can be inflated by heavily depreciated older assets or by running equipment hard without adequate maintenance. Read it alongside margin, return on assets, and asset-condition data.


