Predictive Maintenance ROI: How to Build the Business Case
Predictive maintenance pays for itself on some assets and loses money on others. The difference comes down to the failure history, downtime cost, repair cost, and monitoring cost for the assets you are considering. This guide covers the formula, what a program costs to run, where the savings come from, a worked twelve-month example, and the situations where predictive monitoring is not the right investment.
What Predictive Maintenance ROI Actually Measures
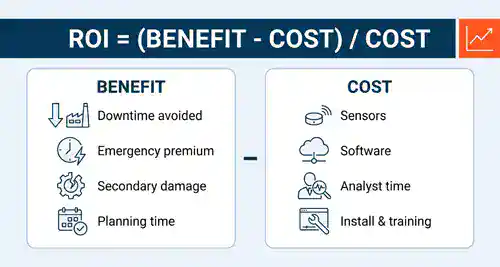
Predictive maintenance ROI is the annual value of failures you converted from unplanned to planned, minus the annual cost of the monitoring program, divided by that cost. Sensor counts, dashboards, and detection accuracy all feed those two numbers, but the ROI still comes down to what you avoided and what you spent.
| Term | Formula | What it answers |
|---|---|---|
| ROI | (Annual Benefit − Annual Cost) ÷ Annual Cost × 100 | Is this worth doing at all? |
| Payback period | Total Upfront Cost ÷ Monthly Net Benefit | How long before the savings recover the upfront cost? |
| Annual Benefit | Downtime Avoided + Emergency Premium Avoided + Secondary Damage Avoided + Life Extension | What does catching it early actually save? |
| Annual Cost | Hardware (amortized) + Software + Installation + Analyst Time + Training | What does the program cost to run, not just to buy? |
What the Department of Energy Actually Publishes
Predictive maintenance ROI claims circulate widely and are frequently overstated. The figures below come from the U.S. Department of Energy’s Operations & Maintenance Best Practices guidance, maintained by Pacific Northwest National Laboratory. They are expressed as cost savings ranges, and they are cumulative — predictive builds on preventive rather than replacing it.
- Preventive vs. reactive: savings of 12% to 18% on average.
- Predictive vs. preventive: a properly functioning predictive program provides a further 8% to 12%.
- Predictive vs. reactive: savings opportunities exceeding 30% to 40%.
A note on the “10:1 ROI” figure. Chapter 5 of the DOE guide publishes a second set of numbers for predictive maintenance: a 10× return on investment, a 25–30% reduction in maintenance costs, a 70–75% elimination of breakdowns, a 35–45% reduction in downtime, and a 20–25% increase in production. The guide attributes these figures to unnamed “independent surveys,” so they are not a benchmark you can audit. More importantly, they describe predictive maintenance, not preventive maintenance. They are often quoted as if they were PM results. They are not. The DOE preventive figure is 12–18%.
What Independent Research Reports
Deloitte’s Industry 4.0 research on predictive technologies for asset maintenance reports that predictive maintenance can:
- Reduce the time required to plan maintenance by 20–50%
- Increase equipment uptime and availability by 10–20%
- Reduce overall maintenance costs by 5–10%
Those are plant-level ranges covering programs at different stages of maturity. A program aimed at your worst-performing critical assets may produce different results from one expanded across a larger, less critical asset population. Build the business case around the assets you actually plan to monitor, not the best result reported in someone else’s program.
What Predictive Maintenance Actually Costs
The price of the sensors and software is only part of the cost. You also need to account for the labor to install and maintain the sensors, review the data, train people, and follow up on problems that are found. Include those costs before calculating the return. Actual costs vary depending on the equipment, sensor technology, plant size, and whether you handle the analysis yourself or use an outside service.
What to Budget For
| Cost line | One-time or recurring | What drives the price |
|---|---|---|
| Sensors | One-time, replaced on a cycle | Measurement points per asset, not asset count. A pump skid may need three. Wired costs less per unit and far more to install; wireless reverses that and adds battery replacement. |
| Gateways and network | One-time | Plant geography and wall construction. Sensors in a sub-basement or inside a metal enclosure need more collection points than a coverage map suggests. |
| Installation and commissioning | One-time | Mounting method, access, and whether equipment must be shut down to fit sensors. Budget this per point, not per asset. |
| Monitoring platform | Recurring, usually per asset per month | Asset count and analysis depth. Raw trending is cheap; full spectrum diagnostics and modeled failure prediction are not. |
| Analyst time | Recurring — the line most often omitted | Someone qualified must interpret the data and decide what to act on. In-house means a fraction of an FTE and certification; outsourced means a per-asset analysis fee. |
| Baseline establishment | One-time, 60–90 days | Condition data is difficult to interpret without a healthy-state baseline for each asset. During this window, do not assume meaningful predictive benefit, even though the program is already incurring cost. |
| Training and change management | One-time, with refreshers | Technicians must act on an alert for an asset that is still running normally. That is a change in how the work gets handled, and it is a common reason a technically sound program produces no return. |
The Cost of an Alert Nobody Acts On
The alert nobody acts on costs the same as the alert that saves you. A predictive program can generate a warning weeks before failure. If the work order that warning should generate is never created, scheduled, and completed, you have paid for the sensor, the platform, and the analyst without getting the maintenance benefit. The technology only has value when the maintenance team can act on the information.
Where the Savings Actually Come From
“Reduced downtime” by itself doesn’t tell you much. Break it down into things you can measure from your own records—hours of downtime avoided, production recovered, overtime avoided, or repair costs reduced. Then you can put a dollar value on each one.
1. Downtime avoided
The largest component, and the one most often estimated rather than calculated. A failure caught early becomes a planned repair in a scheduled window. The saving is not the whole downtime cost — the planned repair still takes the asset out of service — it is the difference between unplanned downtime at full production cost and planned downtime slotted into a window you were going to take anyway. Siemens’ True Cost of Downtime 2024 puts the scale of the underlying problem at $1.4 trillion a year across the Fortune Global 500, roughly 11% of revenue, with the average large plant losing 27 hours a month across 25 incidents.
2. Emergency premium avoided
The same repair costs more at 2 a.m. than at 2 p.m. Overtime rates, expedited freight on parts, contractor call-out fees, and the labor of everyone standing around waiting for a part are all avoidable when the repair is scheduled. This component is the easiest to prove from your own purchase orders and timesheets, which makes it a good place to start.
3. Secondary damage avoided
A bearing replaced at the early defect stage costs you a bearing. The same bearing run to failure can take the shaft, the seal, the coupling, and sometimes the driven equipment with it. Pull the last two years of catastrophic failures from your asset history and compare the parts cost against what the planned repair would have cost. That gap is documented in your records, not estimated.
4. Asset life extension
Equipment that is not repeatedly run to failure lasts longer, which pushes capital replacement further out. This is the slowest benefit to materialize and the hardest to prove inside a twelve-month window. Include it in a five-year model, but leave it out of the year-one calculation. You cannot document it yet, and an unsupported number weakens the ones you can support.
5. Planning and labor efficiency
Deloitte reports predictive maintenance reducing maintenance planning time by 20–50%. Known failure timing means parts are ordered in advance rather than expedited, crews are scheduled rather than scrambled, and the work is bundled with other jobs on the same asset. This can show up as recovered planner and maintenance-team time rather than as a direct cash payment, so quantify it in hours and convert at the appropriate loaded labor rate.
Count each saving once. The most common error in a predictive maintenance business case is double counting — claiming the avoided downtime, then claiming the avoided emergency labor that was already inside the downtime cost, then claiming the parts saving that was already inside the secondary damage figure. Define each component’s boundary before you add them up, and write the boundary down.
Worked Example: Twelve Months on 40 Critical Assets
Sample calculation — not a performance claim
The numbers in this example are fictional and are only here to show how the calculation works. They are not industry averages or expected results.
Your numbers will be different. Actual results depend on the assets you monitor, how they fail, the cost of downtime, labor and parts costs, how much equipment you monitor, and how quickly your team can respond when a problem is detected.
The example below uses the types of inputs a maintenance team may be able to obtain from its own historical records, such as failure count, downtime duration, and repair cost. Replacing the fictional figures with your own data is a useful starting point, but the result still depends on the assumptions used for failure detectability, intervention timing, avoided downtime, planned-repair cost, program cost, and how often detected conditions actually result in a successful intervention.
A useful business case should test more than one scenario. If you cannot establish a reasonable baseline for your critical assets, that baseline is the appropriate first step.
Baseline: what unplanned failure costs today
- 40 critical rotating assets — motors, pumps, compressors, fans
- 22 unplanned failures across those assets in the last 12 months
- Average 4.5 hours of unplanned downtime per failure → 99 hours
- Illustrative fully loaded downtime cost of $9,500 per hour → $940,500
- Illustrative average emergency repair cost of $6,800 per event → $149,600
- Illustrative annual cost of unplanned failure: $1,090,100
Program cost
- 120 measurement points (three per asset) at $290 → $34,800 — one-time
- Gateways, network, and installation → $18,000 — one-time
- Training and commissioning → $12,000 — one-time
- Monitoring platform subscription → $24,000 per year
- Analyst time, 0.25 FTE loaded → $23,750 per year
- Illustrative Year one cost: $112,550. Year two onward: $51,250 (including a $3,500 sensor replacement reserve)
Illustrative benefit calculation
For this example, assume the program identifies 12 of the 22 failures early enough for the maintenance team to intervene before the unplanned failure occurs — a 55% assumed detection-and-intervention rate. This 55% figure is a fictional modeling assumption, not a benchmark or expected result. In an actual business case, this assumption should be tested against the specific failure modes being monitored and modeled across conservative, expected, and optimistic scenarios.
- Downtime avoided: 12 × 4.5 hours = 54 hours. This example credits 70% of the associated downtime cost because a planned repair still consumes some production time → $359,100
- Illustrative emergency premium avoided: 12 × ($6,800 emergency − $2,900 planned) → $46,800
- Illustrative steady-state annual benefit: $405,900
Year One and Year Two Results
| Year 1 | Year 2 onward | |
|---|---|---|
| Benefit realized | $304,425 (9 months — the first 3 are baseline establishment) | $405,900 |
| Program cost | $112,550 | $51,250 |
| Net | $191,875 | $354,650 |
| Illustrative ROI | 170% | 692% |
| Illustrative payback | $64,800 one-time ÷ $29,554 monthly net = 2.2 months of benefit-earning operation, or roughly 5 months from kickoff including the baseline window | |
The results above are highly sensitive to the assumptions. Changing the number of failures, downtime cost, failure-detection rate, percentage of downtime actually avoided, planned-repair duration, repair cost, program cost, or any other input can materially change the result. Some combinations of assumptions can produce a much lower ROI, no return, or a negative return.
Not every failure is detectable with every technology. Not every detected condition will lead to an intervention before failure. A planned repair may take longer than assumed, production may not actually be lost during every hour of downtime, and some failures may have causes that predictive monitoring cannot address.
Use this example as a calculation framework, not a forecast. A stronger business case uses your historical data and tests conservative, expected, and optimistic assumptions for both costs and benefits. Start with your own failure history and the specific failure modes you believe predictive maintenance could realistically detect and act on.
eWorkOrders does not represent that the savings, ROI, payback period, detection rate, or other results shown in this example will be achieved by another organization.
When Predictive Maintenance Does Not Pay
There are assets where predictive maintenance costs more than it saves. Identifying them early keeps the program focused on the equipment where it actually pays, and keeps the overall numbers honest.
The failure is not detectable in advance
Predictive maintenance works on failures with a detectable degradation path — bearing wear, misalignment, imbalance, insulation breakdown, lubricant contamination. Many electronic and control failures are effectively random with no measurable precursor. Instrumenting them produces data, cost, and no warning. For those assets, redundancy and fast replacement may be a better approach.
The consequence of failure is small
If an asset fails and nothing stops — because there is a spare, a bypass, or slack in the schedule — the avoided downtime term in your benefit calculation is close to zero. Run-to-failure can be the right and cheapest strategy for many low-criticality assets. Choosing it deliberately, and documenting why, is part of a well-run program.
The asset is cheap to replace
When the monitoring cost over an asset’s remaining life gets close to the cost of just replacing it when it fails, the answer is replacement. Compare monitoring cost per asset per year against replacement cost, not against catastrophic-failure cost, for anything low in your criticality ranking.
Your preventive program is not working yet
This is the one that matters most. The DOE ranges are cumulative — predictive delivers a further 8–12% on top of a functioning preventive program. If PM compliance is consistently low, there may be more immediate return in fixing the preventive program you already have, without adding sensors or monitoring costs. Predictive maintenance layered onto a program that is already struggling to complete scheduled work can simply add alerts to the same backlog.
Nobody owns the alert
If there is no named owner, no defined response window, and no work order generated when a threshold is crossed, the program will generate warnings that get read and not acted on. That is not a technology problem. Decide who acts, how fast, and what record gets created before you buy anything.
Rank before you instrument. Sort your assets by unplanned failure count × cost per failure, using your own closed work order history. Instrument the top of that list, and only the top. Programs that start plant-wide spread a strong return across assets that never justified a sensor. Knowing where to stop is just as important as knowing where to start.
The Data You Need Before You Can Calculate ROI
Every term in the ROI formula is derived from maintenance history. Teams that cannot calculate predictive maintenance ROI usually do not have a spreadsheet problem. They have a record-keeping problem, and it only becomes visible when someone asks for a business case.
| Input you need | Where it comes from | If you don’t have it |
|---|---|---|
| Unplanned failures per asset, 12–24 months | Closed work orders, filtered by type and asset ID | You cannot rank assets, so you cannot choose what to instrument |
| Downtime duration per failure | Time between failure logged and work order closed | The largest benefit term is a guess, and finance will treat it as one |
| Repair cost per event | Labor hours plus parts consumed, recorded on the work order | You cannot separate the emergency premium from the base repair cost |
| Failure mode distribution | Failure codes recorded at closure | You cannot tell which failures are detectable, so you cannot estimate a catch rate |
| Current PM compliance rate | PMs completed on time ÷ PMs scheduled | You cannot tell whether the cheaper preventive return is still on the table |
| Downtime cost per hour | Finance and operations, not maintenance | Get this agreed in writing before you model anything — it is the number that gets disputed |
Setting Your Downtime Cost per Hour
Downtime cost per hour is the input people most often borrow from an article instead of calculating, and it is the one that changes the answer the most. Published averages span industries with completely different economics, so a figure from a heavy-industry survey tells you little about a mid-size plant with slack in the schedule. Build your own: lost production margin per hour, plus labor standing idle, plus any expedite or overtime cost, minus anything the line genuinely makes up later. Get it agreed on by finance and operations before you model anything, because it is the number that gets challenged first.
How to Phase a Program So the ROI Is Provable
Most predictive maintenance programs cannot prove their results afterward because nobody wrote down what success would look like before the sensors went on. Running the program in phases fixes that.
Phase 1 — Establish the baseline (weeks 1–4, no hardware)
Pull 12–24 months of closed work orders on candidate assets. Produce the failure count, downtime hours, and repair cost per asset. Agree the downtime cost per hour with finance and write it into the project charter. This phase costs nothing but time, and it is what tells you whether the rest is worth doing.
Phase 2 — Pilot the worst 10–15% (months 2–6)
Instrument only the top of the ranked list. Set the response protocol before the first alert: who reviews it, within how many hours, and what work order gets created. Do not assume meaningful predictive benefit during the first 60–90 days while healthy-state baselines are established. Budget for that period up front.
Phase 3 — Measure against the written baseline (months 6–12)
Compare the same three metrics on the same assets: failures, downtime hours, repair cost. Track detection rate as its own number: alerts that preceded a confirmed finding, divided by all alerts. That ratio is one of the numbers you need when deciding whether to expand. Record false alarms too. If technicians are sent to equipment that turns out to be fine often enough, they stop responding to alerts.
Phase 4 — Expand only where the math still works (year 2)
Rerun the ranking with fresh data and instrument the next group of assets only if the return still justifies the spend. The return may be lower than the pilot’s because the pilot started with the worst assets. Stop when the next asset on the list no longer pays for itself, and document that decision. Knowing where to stop keeps a program focused.
Deloitte’s published case results show how wide the range is. A chemical manufacturer reported an 80% reduction in unplanned downtime on a pilot extruder, with savings around $300,000 per asset. Trenitalia reported a 5–8% decrease in downtime and an 8–10% reduction in annual maintenance spend. Both are real; they are simply different assets, different consequences of failure, and different scopes. Yours will be its own number, and the only way to know it is to write down the baseline first.
Where eWorkOrders Fits in Predictive Maintenance
Predictive maintenance does not end when a monitoring system finds a problem. Someone still has to decide what to do, plan the repair, get the parts, assign the work, and record what was done.
That is the CMMS side of predictive maintenance. eWorkOrders does not perform the vibration analysis, thermography, oil analysis, or machine-learning prediction. It gives the maintenance team a place to manage the work that follows.
What the CMMS Handles
- Maintenance history. Failure counts, downtime, labor hours, parts used, and repair costs recorded against assets give the maintenance team the history needed to establish a baseline and measure what changes over time.
- Condition readings. Inspection and PM work orders can record temperatures, pressures, vibration readings, amp draws, meter readings, and other measurements. Keeping those readings with the asset history gives technicians a record they can refer back to when equipment conditions change.
- Maintenance based on equipment use. Meter-based PMs can use run hours, cycle counts, mileage, or other usage measurements instead of relying only on calendar intervals. That lets maintenance schedule some work based on how the equipment is actually being used.
- Turning a condition into a work order. When a monitoring system identifies a condition that needs attention, that information can be used to create a corrective work order. The maintenance team can assign the job, set the due date, identify parts, and document the repair.
- Closing the loop. When the work is finished, the work order records what was done, the labor used, the parts consumed, and the final condition. Over time, those records give the maintenance team the history needed to see whether the same problems are recurring and what they are costing.
The Monitoring System and CMMS Have Different Jobs
Condition monitoring may be handled by specialized systems that measure vibration, temperature, lubrication, electrical characteristics, or other equipment conditions. Those systems provide information about what is happening to the equipment.
The CMMS handles what happens next. When a condition needs attention, maintenance needs a way to turn that information into a job that someone owns and completes.
In practical terms: detect the condition, decide what needs to be done, create the work, complete the repair, and record the result. The monitoring system provides the condition information. The CMMS manages the maintenance work.
Get the maintenance basics working first. If PMs are not consistently being scheduled, completed, and documented, fix that before adding another layer of monitoring. Predictive maintenance works best when the maintenance team already has a reliable process for turning information into completed work.
Start With the Data Your Business Case Needs
Every input in a predictive maintenance ROI calculation — failure counts, downtime hours, repair cost per asset, PM compliance — comes out of closed work orders. eWorkOrders gives your team one place to run preventive maintenance, work orders, asset history, and spare parts, so those numbers exist when someone asks for them. Rated 4.9 stars on Capterra and G2. Over 30 years serving maintenance teams.
Frequently Asked Questions
How do you calculate predictive maintenance ROI?
ROI = (Annual Benefit − Annual Cost) ÷ Annual Cost × 100. Annual Benefit is the sum of downtime avoided, emergency repair premium avoided, secondary damage avoided, and planning efficiency gained. Annual Cost is sensors and gateways amortized, monitoring software, installation, analyst time, and training. Every benefit input should come from your own records — failure count, downtime duration, and repair cost for the assets you intend to monitor.
What is a good ROI for predictive maintenance?
There is no universal figure. The return depends on how often the instrumented assets fail, what those failures cost, whether the failure mode can be detected, and how much the monitoring program costs. A targeted program on frequently failing critical assets can produce a very different result from the same program applied to stable, low-consequence assets. Deloitte reports predictive maintenance increasing equipment uptime by 10–20% and reducing overall maintenance costs by 5–10%, but those figures should be treated as published research ranges, not a forecast for your plant.
How long does predictive maintenance take to pay back?
Budget for an initial 60–90-day baseline period before assuming meaningful predictive benefit, because healthy-state baselines have to be established for each asset before deviations can be interpreted reliably. Payback is then the one-time cost divided by the monthly net benefit. In the worked example on this page — 40 assets with 22 unplanned failures a year — that is roughly 2.2 months of benefit-earning operation, or about 5 months from kickoff. On a better-behaved asset population it is considerably longer, and on some it never arrives.
What does predictive maintenance cost?
There are several costs to budget for, not just hardware and software. A monitoring program can also include sensors, gateways and network equipment, installation and commissioning, analyst time, the initial baseline period, training, and ongoing software costs. Analyst time and training are easy to leave out of a budget, but they can determine whether the program actually gets used. An alert that nobody reviews or acts on costs the same as one that prevents a failure.
Is predictive maintenance worth it for a small facility?
Sometimes, on a small number of assets. The test is not facility size — it is whether you have assets that fail often, fail expensively, and fail with a detectable degradation path. A small plant with three critical compressors that each fail twice a year may have a stronger case than a large plant with a stable asset base. Rank by unplanned failure count multiplied by cost per failure and instrument only the top of that list, whatever the size of the site.
Does a CMMS do predictive maintenance?
A CMMS handles the maintenance-management side: recording condition readings, triggering PMs on meter readings rather than the calendar, turning information from a monitoring system into a work order, and holding the failure and cost history used to measure the program. It does not perform the condition detection itself. Vibration spectrum analysis, thermography, oil analysis, ultrasonic testing, and machine-learning failure modeling are handled by specialized technologies and trained personnel. In a typical setup, the monitoring system identifies a condition and the CMMS manages the maintenance work that follows.
Why do published predictive maintenance ROI figures vary so much?
Because they measure different things on different assets, and because two separate DOE figure sets get mixed together. The DOE O&M Best Practices Guide publishes cost savings ranges — 12–18% for preventive against reactive, a further 8–12% for predictive over preventive, and 30–40%+ for predictive against reactive — and, separately in Chapter 5, a predictive maintenance set attributed to unnamed “independent surveys”: 10× ROI, 25–30% lower maintenance costs, 70–75% elimination of breakdowns, 35–45% less downtime. That second set is often misquoted as preventive maintenance results. Vendor case studies add another layer, often reporting single-asset pilots on deliberately chosen problem equipment. None of these figures predicts what your plant will achieve. Build the case on your own failure data.
Should we fix our preventive program before adding predictive?
Almost always, yes. The DOE savings ranges are cumulative — predictive delivers its 8–12% on top of a functioning preventive program, not instead of one. If PM compliance is consistently low, the available return may be in closing that gap before adding sensors, gateways, or analyst costs. Predictive alerts added to a program that is already deferring scheduled work can simply join the same backlog.
Sources
2. DOE FEMP O&M Best Practices Guide, Release 3.0, Chapter 5 — Types of Maintenance Programs (predictive maintenance: 10× ROI, 25–30% lower maintenance costs, 70–75% elimination of breakdowns, 35–45% less downtime, 20–25% production increase; attributed there to unnamed “independent surveys”) ·
3. FEMP Operations & Maintenance Best Practices, Release 3.0 — WBDG ·
4. Deloitte Insights — Industry 4.0 and predictive technologies for asset maintenance (planning time −20–50%; uptime +10–20%; maintenance costs −5–10%; Trenitalia and chemical manufacturer case results) ·
5. Siemens Senseye — The True Cost of Downtime 2024 ($1.4 trillion, 11% of revenue; 27 hours per month across 25 incidents at the average large plant)
Important Notes and Disclaimers
Sample calculation: The figures in the twelve-month example are fictional and are included only to show how the calculation works. They are not a benchmark, industry average, survey result, customer result, or expected result. Use your own maintenance history and costs when building a business case.
Third-party sources: Research and figures are cited for reference and attributed to their publishers. Figures may be revised by their publishers.
Scope: This is a general educational guide, not financial, legal, or engineering advice. Condition monitoring work should be performed by appropriately trained personnel.
About the Author
Janet Jaquis is a CMMS software specialist with over 8 years at eWorkOrders, where she develops educational content, technical guides, and implementation resources for maintenance management professionals. Her work covers preventive maintenance, work order management, asset reliability, inventory management, and CMMS implementation across manufacturing, healthcare, government, food and beverage, and facilities operations, grounded in customer case studies, industry research, and ongoing engagement with the eWorkOrders product team.


