OEE Software: How to Track and Improve Overall Equipment Effectiveness
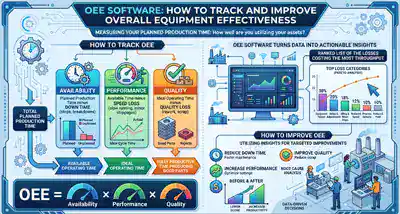
OEE software measures how much of your planned production time actually produces good parts at full speed. It turns availability, performance, and quality into one number — and, more usefully, into a ranked list of the losses costing you the most throughput.
What Is OEE Software?
OEE software is a system that collects production data from equipment and calculates Overall Equipment Effectiveness — the percentage of planned production time that is truly productive. It multiplies three factors: availability, performance, and quality. The software identifies which losses are reducing throughput so teams can act on the largest ones first.
The metric itself predates the software by decades. Overall Equipment Effectiveness comes out of Total Productive Maintenance, the manufacturing discipline pioneered in Japan by Seiichi Nakajima (1919–2015), whose Introduction to Total Productive Maintenance was published in English in 1988. What changed is the data collection. Calculating OEE by hand from shift logs and scrap tickets is slow and error-prone. Software automates the capture.
What OEE Software Actually Does
- Captures machine state: running, stopped, idle, changeover — with timestamps, from PLCs, sensors, counters, or operator input.
- Counts production: total count and good count, so scrap and rework are separated from saleable output.
- Classifies downtime: assigns a reason code to every stop, which is what makes the data actionable rather than merely descriptive.
- Calculates the three factors: availability, performance, and quality, then multiplies them into OEE.
- Ranks losses: shows which loss categories consume the most production time, by line, shift, product, and asset.
- Trends over time: so teams can tell whether a change to the maintenance plan, the changeover procedure, or the operating standard actually worked.
The point of OEE is not the score. A single OEE percentage tells you very little on its own. The value is in the breakdown — knowing that you lost 14% of planned time to unplanned stops, 9% to reduced speed, and 2% to scrap tells you where to spend the next maintenance dollar.
How Is OEE Calculated? The Formula and a Worked Example
OEE = Availability × Performance × Quality. Each factor is a ratio between 0 and 1, and the three multiply together, which is why OEE falls quickly when any one factor slips.
The Three Factors
| Factor | Formula | What it captures |
|---|---|---|
| Availability | Run Time ÷ Planned Production Time | Time lost to stops — breakdowns, changeovers, material shortages |
| Performance | (Ideal Cycle Time × Total Count) ÷ Run Time | Speed lost while running — minor stops and reduced rate |
| Quality | Good Count ÷ Total Count | Output lost to scrap and rework |
Key Terms
- Planned Production Time: shift length minus scheduled breaks — the window in which production is intended to happen.
- Run Time: Planned Production Time minus all stop time, planned and unplanned.
- Ideal Cycle Time: the fastest cycle the equipment can achieve under optimal conditions.
- Total Count: every part produced, good and rejected.
- Good Count: Total Count minus rejects — parts that met specification without rework.
Worked Example: One Shift
An 8-hour shift with a 30-minute scheduled break. During the shift there is a 20-minute breakdown and a 27-minute changeover. Ideal cycle time is 1.0 second per part. The line produces 19,271 parts, of which 423 are rejected.
- Planned Production Time = 480 − 30 = 450 minutes
- Run Time = 450 − 47 = 403 minutes
- Availability = 403 ÷ 450 = 89.6%
- Performance = (1.0 s × 19,271) ÷ (403 × 60 s) = 79.7%
- Quality = 18,848 ÷ 19,271 = 97.8%
- OEE = 0.896 × 0.797 × 0.978 = 69.8%
Read the breakdown, not the headline. Availability looks healthy at 89.6%. The real loss is performance at 79.7% — the line ran, but well below its ideal rate. That points at minor stops, reduced speed, or an ideal cycle time that was never validated. Chasing more uptime here would be chasing the wrong number.
There is also a shorter route to the same answer. The simple calculation, OEE = (Good Count × Ideal Cycle Time) ÷ Planned Production Time, gives 18,848 seconds ÷ 27,000 seconds = 69.8%. It agrees with the long form but yields no breakdown, which is why the three-factor version is the one worth automating.
What Is a Good OEE Score?
The widely cited world-class benchmark for discrete manufacturing is 85% OEE, made up of 90% availability, 95% performance, and 99% quality. Typical manufacturers score closer to 60%. Very few plants sustain 85%.
| Metric | World-class | Typical |
|---|---|---|
| OEE | 85% | ~60% |
| Availability | 90% | Depends on the process |
| Performance | 95% | Process-dependent |
| Quality | 99% | Set against your own baseline |
Two independent reference points are worth knowing. OEE.com, which maintains the most widely referenced public definition of the metric, reports that most manufacturers score closer to 60% and that they encounter more plants below 45% than above 85%. Separately, machine-monitoring vendor Evocon analysed more than 3,500 connected machines across 50-plus countries between May 2023 and June 2024 and found most organizations clustered at 55–60%, with roughly 6% reaching 85% or better — a figure the authors suggest is closer to 3% once calculation errors are excluded.
Why You Should Not Chase 85%
The 85% figure has a specific origin: Japanese automotive manufacturing in the 1970s. OEE.com itself cautions against fixating on the absolute value rather than the ability to improve it, and warns that applying one uniform target across dissimilar processes in the same plant is counterproductive. A high-mix line running frequent changeovers will never post the same OEE as a continuous line running one product, and forcing them to the same target usually produces one of two things: gaming, or a demoralized crew.
A more useful discipline is to establish your own baseline, segment it by line and product, and measure the trend. An OEE that moves from 52% to 61% over two quarters is a genuine result. An OEE of 78% with no idea how it was calculated is not.
Beware inflated scores. The most common way OEE gets overstated is by shrinking planned production time — excluding changeovers, meetings, or scheduled maintenance from the denominator. If your OEE jumped without any operational change, check the definition of planned production time before you celebrate.
The Six Big Losses OEE Software Should Identify
The Six Big Losses are the standard categorization of everything that reduces OEE. Each maps to one of the three factors, which is what turns a score into a work list.
Availability Losses
- 1. Equipment failure. Breakdowns, tooling failure, and unplanned maintenance. Also starvation from upstream equipment and blockage from downstream equipment. This is the loss category a maintenance program most directly controls.
- 2. Setup and adjustments. Changeovers, major and tooling adjustments, cleaning, warmup, planned maintenance, and quality inspections. Usually attacked with SMED and changeover standardization rather than with maintenance.
Performance Losses
- 3. Idling and minor stops. Misfeeds, material jams, obstructed product flow, incorrect settings, misaligned or blocked sensors, equipment design issues, and quick cleaning. Individually trivial, collectively the most under-measured loss in most plants — because stops shorter than the logging threshold never get recorded.
- 4. Reduced speed. Dirty or worn equipment, poor lubrication, substandard materials, poor environmental conditions, operator inexperience, and startup or shutdown ramps. Several of these are maintenance conditions, which is why performance loss is not purely a production problem.
Quality Losses
- 5. Process defects. Incorrect equipment settings, operator or equipment handling errors, and lot expiration.
- 6. Reduced yield. Scrap produced between startup and stable production — suboptimal changeovers, wrong settings on a new part, warmup cycles, and equipment that inherently wastes material after startup.
Loss category 1, equipment failure, is where maintenance has direct leverage, and it is prevented by a working preventive maintenance program. Category 2 is partly maintenance as well, since planned maintenance is one of the stops counted there. The remaining four categories are measured in production data — cycle counts against ideal cycle time, and scrap against total count — and are owned by production rather than maintenance.
OEE vs. TEEP: Two Different Questions
OEE measures the percentage of planned production time that is truly productive. TEEP — Total Effective Equipment Performance — measures the percentage of all time that is truly productive. TEEP = OEE × Utilization, where Utilization = Planned Production Time ÷ All Time.
The distinction matters when the question is capacity rather than efficiency. A plant running two 8-hour shifts, five days a week, has 80 scheduled hours out of the 168 in a week — a utilization of 47.6%. At 65% OEE, that plant’s TEEP is 30.9%. Its equipment is producing good parts at full speed for less than a third of the calendar.
That gap is sometimes called the hidden factory. Before signing a capital request for a new line, TEEP is the number worth checking, because adding a shift is usually cheaper than adding equipment. OEE answers “how well are we running when we run?” TEEP answers “how much more could we get out of what we already own?”
What to Look For in OEE Software
The market ranges from single-machine monitoring boxes to full MES platforms. The following criteria separate systems that change behaviour from systems that produce reports nobody reads.
Data Capture and Accuracy
- Automated data capture. If operators must type in downtime at the end of a shift, the data will be incomplete and retrospectively rationalized. Capture from PLCs, counters, or sensors wherever the equipment allows it.
- Downtime reason codes at the point of the stop. A stop without a reason code is a number you cannot act on. The reason list should be short, mutually exclusive, and defined by the people who use it.
- Minor stop resolution. Ask what the minimum detectable stop duration is. Systems that only log stops over five minutes will systematically hide your largest performance loss.
- An auditable, documented OEE definition. You should be able to see exactly what the system counts as planned production time. If you cannot, you cannot defend the number.
- Segmentation. OEE by line, shift, product, and asset. A plant-level average hides everything that matters.
Reporting, Integration, and Floor Visibility
- Integration with maintenance. A downtime event caused by equipment failure should be able to generate or link to a work order, so the loss and the repair live in the same record.
- A documented API. OEE data is most valuable when it can be joined to maintenance history, parts consumption, and asset cost. That requires an open integration path.
- Operator-facing displays. The people who can influence OEE in real time are on the floor. A dashboard only management sees will not move the number.
One question worth asking every vendor: “Show me exactly how your system defines planned production time, and show me the smallest stop you can detect.” The answers to those two questions determine whether the OEE number you get is comparable to anyone else’s — or to your own, six months from now.
Where OEE Software and a CMMS Meet
OEE software and a CMMS answer different halves of the same question. OEE tells you that you lost 41 minutes to equipment failure on line 3 last Tuesday. A CMMS tells you what failed, why, who repaired it, what part went in, how long the repair took, and whether that asset has failed the same way four times this quarter.
Neither is complete alone. An OEE system without maintenance history gives you a loss you cannot diagnose. A maintenance system without production data gives you a repair record with no measure of what the failure cost in throughput.
What the Maintenance Side Contributes to OEE
- Failure history by asset. Recurring equipment failure is an availability loss with a root cause, and the work order record is where that cause is documented.
- PM compliance. A declining PM compliance rate usually shows up as an availability loss weeks later. It is a leading indicator for OEE.
- MTBF and MTTR. Mean time between failures explains how often availability loss occurs; mean time to repair explains how long each event lasts. Both are calculated from work order data.
- Spare parts availability. A repair that waits on a part converts a short stop into a long one. Parts inventory tied to critical assets is an availability control.
- Downtime duration and maintenance cost per asset. How long each stop lasted and what the repair cost in labor and parts. This is what converts an availability loss into a number a plant manager can weigh against a capital request.
The practical arrangement in most plants is that the OEE or MES layer captures machine state and counts, and the CMMS owns the maintenance response and the asset history, with the two connected through an API. That way, an availability loss can be traced to a specific asset, a specific failure mode, and a specific repair.
How eWorkOrders Supports OEE Improvement
eWorkOrders is a CMMS, not an MES or machine-data platform, so it doesn’t calculate OEE itself. Instead, it helps maintenance teams improve the maintenance factors that affect OEE, including equipment availability, downtime, and recurring equipment problems. eWorkOrders can also connect with other systems that collect production data, helping maintenance teams act on the issues affecting machine performance.
What eWorkOrders Covers
- Preventive maintenance scheduling. PM programs that reduce equipment failure, the first of the Six Big Losses. See preventive maintenance.
- Work order management. Every failure, repair action, labor hour, and downtime duration recorded against the asset. See work order management.
- Asset history. A permanent record per asset, which is what makes repeat-failure analysis possible. See asset management.
- Downtime and maintenance costs. How long each stop lasted and what the repair cost in labor, parts, and contractor time, tracked against the asset. This is the maintenance side of an availability loss expressed as a number, which is what makes a repair-or-replace case or a capital request defensible.
- Meter readings. Trigger PM tasks from runtime, cycle counts, or usage rather than the calendar. See meter readings.
- Spare parts inventory. Reorder points and parts-to-asset linkage, so a critical repair is not waiting on a shelf. See spare parts inventory.
- KPI dashboards. MTBF, MTTR, PM compliance, backlog, and emergency work order rate — the maintenance metrics that sit underneath an availability trend. See dashboards and KPIs.
- Documented API. Connect production, sensor, and facility automation systems so downtime events and maintenance records can be joined. See system integration.
eWorkOrders is browser-based and runs on desktop, tablet, and smartphone with no app to install, so technicians can close out work at the equipment rather than back at a desk — which is what keeps downtime duration accurate rather than estimated.
A Note on Where the OEE Calculation Lives
Between user-defined fields, meter readings, the API, and custom reports, the building blocks exist to hold production values inside eWorkOrders if an operation wants everything in one place. In practice, that is rarely the sensible arrangement. Production systems are built to capture machine state and part counts at the resolution OEE requires, and maintenance systems are built to capture failure cause, repair history, and parts consumption. Most teams are better served keeping the OEE calculation where the production data originates and integrating the two, so an availability loss can be traced to the asset, the failure mode, and the repair that followed. Where that connection is worth building, it is a conversation worth having with both vendors before committing to either approach.
Control the Maintenance Half of Your OEE
Equipment failure and reduced speed are maintenance losses. eWorkOrders gives your team one place to manage preventive maintenance, work orders, asset history, and spare parts — so availability losses have a root cause you can find and fix. Rated 4.9 stars on Capterra and G2. Over 30 years serving maintenance teams.
Frequently Asked Questions
What is OEE software?
OEE software collects production data from equipment and calculates Overall Equipment Effectiveness — the percentage of planned production time that is truly productive. It multiplies availability, performance, and quality, and breaks the result into loss categories so teams can see which losses are costing the most throughput.
How is OEE calculated?
OEE = Availability × Performance × Quality. Availability is Run Time divided by Planned Production Time. Performance is Ideal Cycle Time multiplied by Total Count, divided by Run Time. Quality is Good Count divided by Total Count. A shorter equivalent is Good Count multiplied by Ideal Cycle Time, divided by Planned Production Time — but it gives no loss breakdown.
What is a good OEE score?
The widely cited world-class benchmark for discrete manufacturing is 85%, composed of 90% availability, 95% performance, and 99% quality. Most manufacturers score closer to 60%. These are general reference points, not standards — achievable OEE varies substantially by process, product mix, and changeover frequency, so your own baseline and trend matter more than the benchmark.
What are the Six Big Losses in OEE?
Equipment failure and setup or adjustments reduce availability. Idling and minor stops, and reduced speed, reduce performance. Process defects and reduced yield reduce quality. Categorizing losses this way turns an OEE score into a ranked list of problems to work on.
What is the difference between OEE and TEEP?
OEE measures the percentage of planned production time that is truly productive. TEEP measures the percentage of all calendar time that is truly productive, calculated as OEE multiplied by Utilization, where Utilization is Planned Production Time divided by All Time. OEE is an efficiency question; TEEP is a capacity question.
Can a CMMS calculate OEE?
A CMMS does not calculate OEE. Availability, performance, and quality are all measured from production data — machine state, cycle counts, and part counts — which a CMMS does not collect. What a CMMS owns is the maintenance response behind availability loss: what failed, why, how long the repair took, what parts it consumed, and what it cost. Most plants pair an OEE or MES layer that captures machine state and counts with a CMMS that owns maintenance response and asset history, connected through an API.
Why did our OEE score jump without anything changing?
The most common cause is a change to the definition of planned production time. Excluding changeovers, meetings, or scheduled maintenance from the denominator inflates OEE without any operational improvement. Before accepting a sudden increase, confirm that the planned production time definition has not changed.
Sources
2. World-Class OEE benchmarks — OEE.com ·
3. The Six Big Losses defined — OEE.com ·
4. TEEP: Total Effective Equipment Performance — OEE.com ·
5. Evocon — World-Class OEE: Industry Benchmarks From More Than 50 Countries (3,500+ machines, May 2023–June 2024) ·
6. Seiichi Nakajima (1919–2015), founder of Total Productive Maintenance
Important Notes and Disclaimers
Benchmark disclaimer: The OEE benchmarks referenced in this article, including the 85% world-class figure and its 90/95/99 components, are widely used industry reference points rather than formal standards issued by a standards body. Achievable OEE varies substantially by industry, process type, product mix, changeover frequency, and how an organization defines planned production time. Figures are presented for general educational comparison and are not a prediction, guarantee, or representation of results any specific facility will achieve.
Third-party sources: Third-party research and definitions are cited for reference and attributed to their publishers. Citation does not imply endorsement of eWorkOrders by those organizations, or endorsement of those organizations by eWorkOrders. Figures were current as of publication and may be revised by their publishers.
Scope of this article: OEE is a productivity and equipment-effectiveness metric. It is not a safety, environmental, or regulatory compliance measure, and improving OEE does not satisfy any obligation under OSHA, EPA, FDA, or other regulatory programs. Nothing in this article is legal, regulatory, financial, or engineering advice. Consult qualified professionals regarding your specific obligations, equipment, and operating conditions.
About the Author
Janet Jaquis is a CMMS software specialist with over 8 years at eWorkOrders, where she develops educational content, technical guides, and implementation resources for maintenance management professionals. Her work covers preventive maintenance, work order management, asset reliability, inventory management, and CMMS implementation across manufacturing, healthcare, government, food and beverage, and facilities operations, grounded in customer case studies, industry research, and ongoing engagement with the eWorkOrders product team.


