How to Use a Fishbone Diagram (Ishikawa) for Maintenance Root Cause Analysis
A fishbone diagram spreads every possible cause of an equipment failure across six categories — the 6 Ms — so your team investigates the whole problem instead of chasing the first guess.
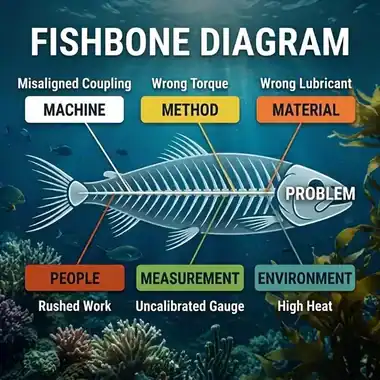
What is a fishbone diagram?
This fishbone diagram maintenance guide explains a cause-and-effect tool that maps every potential cause of a problem onto branches fanning out from a single horizontal “spine,” grouping those causes into standard categories so a team sees the full picture before committing to a fix. The problem you are investigating — the failure, or “effect” — sits in the fish’s head on the right. Diagonal “bones” angle into the spine, and each one carries a category of possible cause with its individual contributing factors branching off it. The finished sketch resembles a fish skeleton, which is where the name comes from.
It is also called an Ishikawa diagram and, more plainly, a cause-and-effect diagram — three names for exactly the same tool. Its value in maintenance is simple: it is a structured brainstorm. Instead of the team latching onto the first plausible explanation for a breakdown and stopping there, the fishbone forces every category of cause onto the board — the human, procedural, material, and environmental factors behind a failure, not just the part that broke. That breadth is what makes it a foundational technique in root cause analysis (RCA).
Where the Ishikawa diagram came from — and why maintenance teams use it
The fishbone diagram was developed by Kaoru Ishikawa, a Japanese quality-control engineer, who formalized it at Kawasaki in the 1960s and made it one of his “seven basic tools of quality,” as the American Society for Quality (ASQ) documents. Ishikawa’s insight was that most defects and failures are not caused by one thing — they emerge from the interaction of several contributing conditions, and people investigating them tend to fixate on the most visible one. Giving a team pre-set categories to brainstorm against counters that bias directly, which is why the tool spread from manufacturing quality into reliability and maintenance.
In a maintenance context, the fishbone earns its place in root cause analysis for three reasons. First, it is fast and cheap — a whiteboard, a marker, and the people who were on the floor when the asset failed. Second, it is visual, so a mixed group of operators, technicians, planners, and supervisors can all contribute and see how their pieces connect. Third, and most important, it fights tunnel vision: a recurring bearing failure “obviously” caused by a bad bearing might actually trace back to a misaligned coupling, a wrong lubrication interval in the PM, or heat from an adjacent line — causes a parts-swap will never fix. The fishbone puts all of those candidates on the same board so the team investigates the failure instead of the symptom.
One caution is built into the method from the start: a fishbone identifies possible causes — it does not prove any of them. In other words, it is a hypothesis-generating tool, not a verdict. The proving happens afterward, against evidence, which is where the maintenance record and the deeper analysis techniques below come in.
The 6 Ms explained, with maintenance examples
The 6 Ms are the standard set of cause categories used to structure a fishbone in manufacturing and maintenance: Machine, Method, Material, People (Manpower), Measurement, and Environment (Mother Nature). Each becomes one main bone, and the team brainstorms specific contributing causes under it. The categories exist to prompt the team — to guarantee that no whole class of cause gets skipped — not to constrain them. The table below defines each M and shows the kind of maintenance-specific causes that live under it.
| Category (M) | What it covers | Example maintenance causes to brainstorm |
|---|---|---|
| Machine | The equipment itself — its design, condition, wear, and the tooling used on it | Worn or misaligned coupling, out-of-spec bearing fit, unbalanced rotor, degraded seals, missing guarding, no vibration or condition monitoring installed |
| Method | The procedures and the way the work is actually performed | Lubrication interval too long, no alignment check written into the PM, incorrect torque sequence, no lockout/verification step, wrong reassembly order |
| Material | Parts, consumables, lubricants, and other physical inputs | Wrong grease specification, counterfeit or non-OEM bearing, contaminated hydraulic fluid, defective replacement part, mixed incompatible lubricants |
| People / Manpower | The people doing and supervising the work — skills, staffing, and workload | Technician not trained on that asset, rushed reassembly under production pressure, no second set of eyes, shift-handoff gap, unclear responsibility |
| Measurement | Inspection, data, gauges, and calibration used to judge condition | Miscalibrated torque wrench or gauge, no baseline vibration reading, missed inspection route, sensor drift, condition thresholds set wrong |
| Environment / Mother Nature | The operating environment and external conditions around the asset | High ambient heat, dust or moisture ingress, corrosive washdown, vibration from an adjacent line, voltage fluctuation, freeze-thaw cycling |
Adapting the 6 Ms to your team
The 6 Ms are a starting checklist, not a straitjacket. Service, facilities, and administrative teams often swap in a modified set — for example the 4 Ss (Surroundings, Suppliers, Systems, Skills) or a simple 4M/5M subset — and a small, well-scoped problem may only need three or four branches. Adapt the categories to the asset and the failure. The goal is coverage: ready-made prompts so no entire category of cause is forgotten before the team even starts.
How to build a fishbone diagram for a maintenance failure
You build a maintenance fishbone by stating the failure precisely, drawing the categories, brainstorming causes under each, drilling into the promising branches, and then verifying the causes that matter against evidence. It is a team exercise, not a solo desk task — pull in the operator and technicians who were present, because they hold the details that make the diagram accurate. Work through it in this order:
- 1. Define the problem exactly. Write the specific failure in the fish head: “Line 3 conveyor gearbox bearing failed after 400 running hours,” not “conveyor problems.” Include the asset, the failure mode, and any measurable detail (time in service, symptom, when it started recurring). A vague head produces a vague diagram.
- 2. Draw the spine and the main bones. Draw a horizontal arrow into the head, then add one diagonal bone per category — Machine, Method, Material, People, Measurement, Environment. Label them before anyone starts calling out causes.
- 3. Brainstorm causes under each M. Take the categories one at a time and ask, “How could something here have contributed to this failure?” Add every idea as a smaller bone off that branch. Capture everything without debating it yet — quantity first, judgment later. Sub-causes can branch off sub-causes.
Drilling in, ranking, and verifying your fishbone diagram
- 4. Drill into the promising branches. For each cause that looks real, keep asking “why does that happen?” This is exactly where 5 Whys nests inside a single bone — you follow one branch down until you reach a cause you can actually act on, rather than stopping at a symptom.
- 5. Rank the likely causes. With the board full, the team marks the branches most likely to be the real contributors. Multi-voting or a quick high/medium/low tag works fine. You are narrowing a wide field to a short list worth testing.
- 6. Verify before you act. A fishbone lists possible causes; it proves none of them. Confirm the leading candidates against evidence — the failed part, inspection and vibration data, and the asset’s repair history — before you commit a corrective action. Acting on an unverified branch is just a better-organized guess.
Every branch you can back with data gets stronger when the history is already captured. In a CMMS like eWorkOrders, when technicians close work orders against standardized failure codes, the repair record for that asset becomes the evidence you test each branch against — which turns a whiteboard brainstorm into a decision grounded in what actually happened.
Worked example: a recurring conveyor bearing failure
Here is how the method plays out on a real-shaped problem. The effect in the fish head: “Line 3 conveyor drive-end bearing has failed three times in six months, each time after roughly 400 running hours.” A parts-only response — swap the bearing again — has already failed twice, which is the signal that the real cause sits somewhere other than the bearing. The team maps candidate causes across all six branches:
- Machine: the drive coupling is slightly misaligned, putting a side load on the bearing; the shaft shoulder shows fretting. No vibration sensor is fitted, so early wear went unseen.
- Method: the PM specifies re-greasing but has no shaft-alignment check after belt tensioning; the reassembly torque sequence is not documented.
- Material: the last two bearings were a non-OEM substitute pulled from a bin; the grease on the shelf is a general-purpose type, not the high-temperature spec the OEM calls for.
- People: whoever was free changed the bearing, under pressure to restart the line; there is no alignment sign-off and no second check.
- Measurement: no baseline vibration reading exists for this drive, and the dial indicator used for alignment was last calibrated over a year ago.
- Environment: the drive end sits next to a heat-treat oven; ambient temperature at that location runs high, and airborne dust is heavy.
Resolving the worked example
Now the team ranks and tests. The 400-hour regularity and the side-load evidence on the failed parts point hardest at the Method + Machine combination — a missing alignment step letting coupling misalignment load the bearing — amplified by the wrong-grease Material branch and the high-heat Environment branch. Running 5 Whys down the Method branch reaches the actionable root: the PM was copied from a generic template and never included an alignment check for this drive. The corrective actions write themselves — add a laser-alignment step and a baseline vibration reading to the PM, correct the grease spec and lock the OEM bearing part number in the catalog, and evaluate a heat shield. Notice that a bearing was never the root cause; it was the part that kept absorbing the real one.
Fishbone vs 5 Whys vs FMEA — when to use which
Fishbone, 5 Whys, and FMEA solve different parts of the reliability problem, so the honest answer to “which is best” is usually “which job are you doing right now.” A fishbone is broad — it lays out the full range of possible causes across categories. 5 Whys is deep — it drives one cause chain down to its root. FMEA is forward-looking — it ranks how an asset could fail so you act before it does. The table sorts out when each fits.
| Dimension | Fishbone (Ishikawa) | 5 Whys | FMEA |
|---|---|---|---|
| Core purpose | Brainstorm and organize all possible causes of one failure | Trace a single cause chain to its underlying root | Anticipate and prioritize failure modes before they occur |
| Direction | Broad — spreads outward across categories | Deep — drills down one line of cause | Forward — looks ahead at what could fail |
| When to use | Early in an investigation, when the cause is unclear and could be anywhere | Once you have a likely cause and need the real root behind it | Proactively during design, PM planning, or reliability review |
| Timing | Reactive — after a failure | Reactive — after a failure | Proactive — before failure |
| Team & effort | Group brainstorm, low effort, minutes to an hour | Small group or individual, very quick | Cross-functional, structured, most time-intensive |
| Output | A map of candidate causes to test | One root cause and a corrective action | Ranked risks (RPN) with prevention actions |
| Main limitation | Lists possibilities, proves nothing; can get cluttered | Can oversimplify multi-cause failures; depends on who is asking | Heavier to build and maintain; needs good data |
How to combine all three
The three tools are strongest chained together, not chosen between. A practical sequence after a significant failure: use the fishbone to widen the search across the 6 Ms so nothing is missed; run 5 Whys down the branches that look real to confirm the true root rather than a symptom; then feed the verified cause into your FMEA so that failure mode gets scored and designed out for next time. The fishbone keeps the team from tunnel vision, 5 Whys keeps it from stopping at a symptom, and FMEA turns the lesson into scheduled, tracked prevention. That loop is what moves a shop from reactive firefighting toward genuine reliability.
Common fishbone mistakes — and how CMMS data strengthens the diagram
Most fishbone failures come from a handful of avoidable habits. Fortunately, pairing the brainstorm with real maintenance data fixes most of them. Here are the frequent mistakes:
- A vague problem statement. “Pump issues” gives you a diagram full of guesses. State the exact asset, failure mode, and measurable detail so every branch stays relevant.
- Listing symptoms as causes. “Bearing overheated” is a symptom; keep asking why until you reach something you can act on.
- Stopping at the diagram. The fishbone is the hypothesis, not the conclusion. Teams that skip verification “fix” the wrong branch and see the failure return.
- Brainstorming without the floor. A diagram built by supervisors alone misses what the operators and technicians actually saw.
- Overloading one board. Trying to analyze several different failures at once produces a tangle. One effect per diagram.
- Treating the 6 Ms as mandatory. Force-fitting causes into categories that do not apply wastes time; adapt the categories to the asset.
This is where a CMMS makes the difference between a guess and an analysis. Failure history and standardized failure codes give every branch something to test against: repeat-failure patterns on an asset point you straight to the categories worth investigating, work-order notes and downtime records show what was actually done and when, and coded failure data tells you whether the same mode keeps recurring. A CMMS stores that history so the evidence is already there when you need it — the fishbone tells you what to check, and the record tells you whether the check holds up. Once a root cause is confirmed, the same system carries it forward into a scheduled PM, an inspection route, or a condition-based trigger so the fix is tracked rather than forgotten.
Key takeaways
The method in brief: A fishbone (Ishikawa) diagram organizes the possible causes of one equipment failure across the 6 Ms — Machine, Method, Material, People, Measurement, and Environment — so a team investigates the whole problem instead of the first guess. Build it by stating the failure precisely, brainstorming causes under each category with the people who were there, drilling into the promising branches (5 Whys nests neatly inside one bone), and verifying the leading candidates against evidence before acting. Remember it lists possible causes and proves none — use maintenance history and failure codes to confirm the real one. For a full workflow, pair it with the tools around it: fishbone to widen the search, 5 Whys to find the root, and FMEA to prevent the failure from returning.
Turn root cause analysis into tracked prevention with eWorkOrders
For over 30 years, eWorkOrders has helped maintenance teams — including operations at McDonald’s, Burger King, and Honda — turn a confirmed root cause into a scheduled PM, an inspection route, or a condition-based trigger, backed by standardized failure codes and full asset history so the fishbone’s leading branch is easy to verify. Reporting and KPI dashboards then show whether the fix actually held, backed by a 4.9 rating on both Capterra and G2.
Frequently Asked Questions
What is a fishbone diagram used for?
A fishbone diagram is used to organize the possible causes of a problem into categories so a team can investigate a failure systematically instead of guessing. In maintenance it is a core root cause analysis tool, mapping the machine, procedural, material, human, measurement, and environmental factors behind an equipment failure before any fix is chosen.
What are the 6 Ms of a fishbone diagram?
The 6 Ms are the standard cause categories used to structure a fishbone diagram: Machine, Method, Material, People (Manpower), Measurement, and Environment (Mother Nature). Each forms one main branch, and the team brainstorms specific possible causes under each so no whole class of cause is overlooked. The set can be adapted — service teams sometimes use Surroundings, Suppliers, Systems, and Skills instead.
Is a fishbone diagram the same as an Ishikawa diagram?
Yes. Fishbone diagram, Ishikawa diagram, and cause-and-effect diagram are three names for the same tool. It is called Ishikawa after Kaoru Ishikawa, the Japanese quality engineer who developed it in the 1960s, and fishbone because the finished diagram resembles a fish skeleton.
What is the difference between a fishbone diagram and 5 Whys?
A fishbone diagram is broad and 5 Whys is deep. The fishbone spreads out the full range of possible causes across categories, while 5 Whys drills down a single cause chain to its root by repeatedly asking why. They work well together: use the fishbone to surface candidate causes, then apply 5 Whys to the branches that look most likely to reach the true root cause.


