No matter the size or type of your organization, proper maintenance is essential to prevent any unplanned downtime. Luckily, that’s where maintenance metrics step in. With the help of sophisticated maintenance metrics software, keeping your assets and equipment running at peak performance becomes easier than ever.
Therefore, let’s take a look at some of the most essential maintenance metrics and see how they can help you with tracking maintenance metrics, predict future performance and create an in-depth maintenance schedule that’s on par with world class maintenance.
And, needless to say, with the help of the right preventive maintenance metrics software, you will be able to analyze data easily thus significantly reducing unplanned downtime.

Three Main Metrics in Maintenance Metrics
Mean Time to Repair (MTTR), Mean Time Between Failures (MTBF) and Mean Time to Failure (MTTF) make the core of maintenance performance metrics. With these key performance indicators, you can easily assess your overall equipment effectiveness, plan out your maintenance activities and develop a thorough maintenance strategy that will significantly reduce maintenance hours spent to enure that everything is running smoothly.
So, let’s discuss what each of those acronyms means, and how you can use them to improve your operations and greatly reduce your maintenance expenses. Also included are some additional commonly used maintenance metrics to help you get an even better understanding of your maintenance needs and thus help you reach your maintenance goals.
Mean Time To Repair (MTTR)
Mean Time To Repair (MTTR) is a key performance indicator that represents the average time required to analyze data, assess equipment effectiveness, troubleshoot and repair equipment that’s faulty or broken. MTTR gives organizations a more accurate analysis of how well their teams are responding to repairs and equipment problems, thus significantly helping to reduce inventory turnover.
Taking too long to repair an asset can easily drive up the maintenance cost, due to equipment downtime. To reduce equipment downtime and improve the effectiveness of these maintenance tasks – as well as their actual performance, many companies purchase spare products so that a replacement can be installed quickly.
Generally, customers will inquire about the turn-around time of repairing a product, which affects MTTR. Companies that align maintenance tasks with asset lifecycle planning experience fewer failures and better ROI.
How is Mean Time To Repair (MTTR) used?
Internal maintenance teams use this metric to keep track of repairs. This is made significantly easier with the help of the right maintenance management software that can help you monitor maintenance activities and organize the necessary preventive maintenance tasks.
How to Calculate Mean Time To Repair (MTTR)
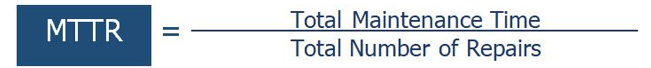
MTTR is easily calculated by using this simple formula:
- Take total time spent on unplanned maintenance for an asset\equipment
- Divide that number by the number of repairs
So, it’s safe to say that MTTR makes up a big portion of planned maintenance percentage.
Example:
- A generator has broken down 10 times during the years.
- You spent 100 hours repairing the generator.
- The MTTR is 10.
- You need to determine what MTTR value is acceptable for your organization.
The Value of Mean Time To Repair (MTTR)
- Allows you to analyze data records to make better decisions on when to repair or replace an asset.
- Gives a snapshot of how quickly the maintenance team responds to failed assets or equipment.
- Gives you a look into how effective and efficient your preventive maintenance program is performing.
- Makes room for new and improved maintenance practices to be implemented.
How to improve Mean Time To Repair (MTTR)
- Keep accurate historic records of repairs and time spent on repairs.
- Document frequently used parts that are needed for repairs.
- Ensure that inventory is well stocked.
- Evaluate the knowledge of the technical staff to determine if additional training or certification is required.
MTTR usually stands for Mean Time To Repair, but it can also represent other metrics (listed below) that you might want to include in your KPIs.
Mean Time To Recovery
This is a good metric for assessing the speed of your overall recovery process. Simply put, Mean Time To Recovery is the average time it takes to recover from an asset or equipment failure. More precisely, it shows how quickly an asset or equipment failure is resolved within your organization.
How to Calculate: Mean Time To Recovery
- Take total time spent on all of the downtime during a specific period
- Divide that number by the number of incidents
Mean Time To Respond
Mean Time To Respond is the average time it takes to recover from an asset or equipment failure from the time of receiving the first failure alert. It is most commonly used in cybersecurity when measuring a team’s success in neutralizing system attacks.
How to Calculate: Mean Time To Respond
- Take total time from alert to when the equipment is fully functional
- Divide that number by the number of incidents
Mean Time To Resolve
Mean Time To Resolve is the average time it takes to resolve an asset or equipment failure from when the cause of the failure is identified and fixed. Compare this metric with Mean Time to Recovery, and the difference between the two metrics shows how fast the team responded to resolving the failure, making the system more reliable and preventing the past incidents from happening again.
This KPI maintenance process is most commonly used when talking about unplanned incidents, not service requests (which are typically planned).
How to Calculate Mean Time To Resolve
- Take the full resolution time during the period you want to track
- Divide that number by the number of incidents
Mean Time Between Failures
Mean Time Between Failures (MTBF) is another one of the key performance indicators that measures equipment reliability and the amount of time that elapses from one failure to the next. These metrics provide detailed and in-depth information on the status of equipment and assets.
This KPI helps organizations optimize preventive maintenance schedules and improve their planned maintenance percentage, to help avoid unexpected failures and unnecessary maintenance.
With MTBF, you can easily assess the expected life span of an asset, as well as the overall asset reliability, which will only help you boost your equipment effectiveness in the long run.
MTBF is commonly used for repairable items.
How is Mean Time Between Failures (MTBF) used?
Mean Time Between Failures is most commonly used by buyers who are looking for equipment reliability.
Internal maintenance teams use this metric to identify issues and track successes and failures, thus reducing maintenance cost.
This maintenance metric is also used to inform customers on when they should bring an asset in for repairs, replace a part or upgrade a system.
How to Calculate Mean Time Between Failures (MTBF)
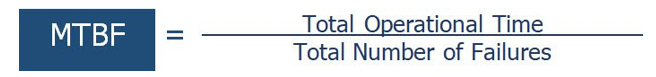
MTBF can easily be calculated by your maintenance department by:
- Identifying the total number of operational hours for a specific asset over a defined timeframe
- Dividing that number by the number of failures that happened during that timeframe
- A low MTBF can be attributed to either an operator error or past repairs that were not properly implemented.
Example
- A piece of equipment has been fully operational for 10,000 hours over a period of one year.
- The equipment broke down 10 times during that timeframe.
- The MTBF for this piece of equipment would be 1,000 hours.
The Value of Mean Time Between Failures (MTBF)
- Identify previous issues and repairs.
- Identify issues and repair timeframes so that you can properly schedule preventive maintenance before the failure.
- Improve product quality and reliability, thus reducing maintenance backlog.
How to Improve Mean Time Between Failures (MTBF)
- Improve preventive maintenance processes.
- Do a root cause analysis and get an understanding of why it failed.
- Look at other options, such as a higher-quality replacement part or a different brand.
- Having a more thorough understanding of your asset and making changes can greatly improve MTBF.
Mean Time To Failures (MTTF)
Mean Time To Failures (MTTF) measures the reliability for non-repairable equipment. It represents the length of time that an asset is expected to last in operation until it fails, which offers valuable insights into maintenance planning. Unlike MTBF which is used for repairable items, MTTF is used when fixing an asset isn’t an option.
How to Calculate Mean Time To Failures (MTTF)
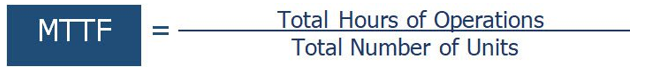
In order to calculate the MTTF most accurately, you will need to take the total number of operational hours and divide that by the number of assets you are monitoring.
Example
- You have four circulating pumps.
- The first circulating pump fails after ten hours.
- The second circulating pump fails after twelve hours.
- The third circulating pump fails after six hours.
- The fourth circulating pump fails after eight hours.
- Total uptime of 36 hours.
- Divide the total uptime of 36 hours by the number of circulating pumps (4), which equals nine hours.
- The final calculation is the average lifespan of that particular type and model circulating pump.
- The conclusion is that this specific make and model of circulating pumps will need to be replaced on an average of every nine hours.
The Value of Mean Time To Failures (MTTF)
- Shows the reliability of the parts, brand, and model pertaining to an asset or piece of equipment.
- The higher the MTTF is, the better your maintenance efficiency and asset utilization measures.
How to Improve Mean Time To Failures (MTTF)
- The best way to improve MTTF is to keep your assets and equipment in good working order.
- Have a good preventive maintenance plan in place.
Find the Best Tools for Effective Maintenance Management at eWorkOrders
![]()
Metrics are crucial to understanding, diagnosing, and resolving the issues that prevent your maintenance organization from operating at peak efficiency. Each metric provides a different insight into the performance of your maintenance operations. When used together, they can give you a more comprehensive insight into how successful your team is in resolving issues and where the team can improve. These testimonials on reporting and dashboards demonstrate how to spot inefficiencies quickly.
Coupled with the right computerized maintenance management system, improving the efficiency of your maintenance team and staying on top of your maintenance metrics will be a piece of cake.
That’s why here at eWorkOrders CMMS we offer services and easy-to-use tools that will help you manage your maintenance operations more efficiently. So, don’t hesitate to check out our projects today, and contact us to learn more about what our software can do for your business.
Final Thoughts
In order to improve asset reliability, maintenance quality metrics need to be a key part of every organization. Since maintenance metrics play such a big role in understanding various maintenance tasks, it ‘s really not surprising that more and more organizations implement them in their bottom line.
Furthermore, asset maintenance metrics provide organizations with a better insight into potential asset or equipment failures. That’s why it’s important to have the right tools, such as eWorkOrders CMMS, that give users the ability to quickly and easily log and keep track of all the pertinent data and labor time.
With such extensive reporting and dashboard features, organizations can easily gain insight into how their maintenance operation is performing, leading to more optimized maintenance planning.
Frequently Asked Questions
What are KPIs for maintenance?
Maintenance key performance indicators are maintenance metrics used to evaluate various factors that are essential to any organization’s success. They include overall equipment effectiveness, planned maintenance percentage, maintenance cost as well as preventive maintenance compliance. When paired with the right software, these important maintenance metrics indicators can help organizations easily reach their business objectives.
What are the 5 pillars of total productive maintenance?
Five main pillars of total productive maintenance are Focused Improvement, Autonomous Maintenance, Planned Maintenance, Quality Maintenance, and Education and Training. Each of these principles plays a crucial role in the overall effectiveness of the TPM strategy, as well as the overall maintenance performance.
How do you measure maintenance effectiveness?
Maintenance effectiveness is most easily measured by gathering and analyzing data on equipment availability, MTBF, MTTR, MTTF, as well as maintenance cost per unit of production. Of course, planned maintenance percentage, preventive maintenance and equipment reliability also play a big role in determining your overall maintenance efficiency.
What are the maintenance KPI benchmarks?
Benchmarks are usually set with defined organization’s goals, so your organization’s maintenance benchmarks may not necessarily be the same as everyone else’s. That being said, these KPI benchmarks usually include maintenance backlog, MTBF, MTTR, MTTF, overall equipment effectiveness, preventive maintenance, as well as all other maintenance processes that will help keep your organization running like a well-oiled machine.
