“eWorkOrders was up and running on the first day, making asset management simple and efficient. The system is easy to use, with fast support, valuable data, mapping, and powerful reporting options.”
A water main bursts at 3 a.m. Crews scramble to manage the situation, thumbing through paper drawings that barely show the underground maze. Every extra minute means soaked concrete, angry tenants, and rising repair costs. Sound familiar? Spreadsheets and static plans list assets, yet they can’t tell you where a buried shut-off valve sits or which rooftop chiller feeds the west wing. GIS asset management software flips that script. It layers every pipe, panel, and pump onto an interactive map, so your team can see problems in real-time and then fix them quickly. In the next sections, you’ll learn how this map-smart approach trims downtime, slashes guesswork, and frees your staff to focus on proactive maintenance instead of emergency triage.
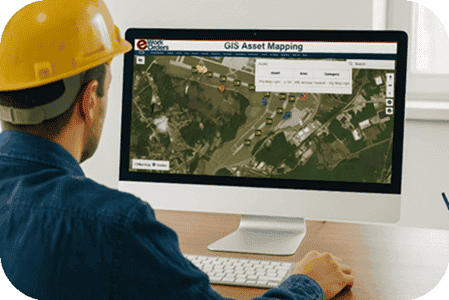
What Exactly Is a GIS Asset Management Software
Most maintenance pros already know the pain of juggling half-finished CAD drawings, siloed CMMS tickets, and field notes scribbled on coffee-stained paper. A geographic information system (GIS) asset management software rolls every scrap of that information onto one live, zoomable map, so nothing slips through the cracks. It boils down to two building blocks:-
- Geographic Information System (GIS) A framework for capturing, storing, and analyzing anything tied to a physical location—streets, parcels, pipes, rooftop chillers, even the parking-lot light that seems to burn out every month.
-
- Asset Management The discipline of tracking an asset’s entire life cycle, from installation to inspections, repairs, and eventual replacement.
Who Gains the Most from GIS Asset Management Software?
Every organization that owns physical infrastructure, including public works agencies, can benefit from mapping its assets, but certain roles feel the payoff immediately.Maintenance Managers & Supervisors
They wrestle with backlogs and emergency calls. A live map highlights overdue inspections, flags risk zones, and lets them cluster work orders—cutting windshield time and overtime in one stroke.Facility Managers
Campus-style sites often conceal equipment in basements, on rooftops, and in utility tunnels. With GIS asset management software, a single click zooms from a bird’s-eye view to a specific air-handling unit, complete with model number, last service date, and a photo for confirmation.Operations Directors
Big-picture thinkers need roll-up metrics and ground-level clarity. Interactive dashboards layer key performance indicators (KPIs)—such as mean time to repair—over geographic heatmaps, allowing directors to spot emerging patterns before they drain budgets.Maintenance Technicians & Team Leaders
Field crews hate guesswork. Mobile GIS maps guide them straight to the right manhole, pole, or pump, even offline. They log fixes once, and everyone sees the update instantly.Service Company Managers
Third-party contractors rely on speed and transparency to win repeat business. Sharing an interactive map of completed and pending tasks builds client trust and shortens billing cycles.Property Management Professionals
Multi-tenant sites juggle HVAC, plumbing, and safety systems across dozens—sometimes hundreds—of units. GIS asset management software ties each component to an exact location and manages service requests, so teams can plan preventive work without disrupting residents.Core Features That Set GIS Asset Management Software Apart
A good map is more than dots and lines. With the right features, it becomes a command center for every maintenance move you make.| Feature | Why It Matters on the Ground |
|---|---|
| Interactive, Layered Maps | Toggle underground utilities on, zoom into a single rooftop unit, or view an entire district at once—no extra software needed. |
| Real-Time Data Sync | Field updates flow straight into the system, so supervisors see fresh status information the second a technician closes a work order. |
| Deep Asset Profiles | Click any pin to open installation dates, parts lists, and inspection photos—perfect for quick diagnostics and warranty checks. |
| Work-Order Integration | When an asset falls below a condition threshold, the software automatically creates a task, assigns it, and pins it on the map, closing the loop without requiring manual re-entry. |
| Spatial Analytics & Predictive Insights | Filter assets by risk zone, overlay storm-drain flooding data, or highlight clusters of recurring failures to prevent problems from spreading. |
| Mobile & Offline Access | Crews pull up maps on tablets—even without a signal—collect GPS coordinates, snap photos, and sync the moment they’re back online. |
The 7-Step Plan for Seamless GIS Integration
Step 1: Stakeholder Alignment
Kick things off by gathering the right voices—maintenance leads, facility managers, IT, finance, and one seasoned field tech. Together, set clear goals: trim leak-response times, boost preventive maintenance compliance, or reduce overtime. Turn each wish into a clear KPI so success is measurable, not murky.Step 2: Data Discovery & Cleanup
Before any map appears, locate every asset ID, GPS coordinate, installation date, and photo. Merge duplicates, standardise names, and double-check coordinates with handheld GPS or drone surveys. Clean data now means accurate maps later—garbage in still equals garbage out.Step 3: Software Selection
Look for a platform that seamlessly integrates into your existing stack. Cloud hosting, an intuitive mobile app, and ready-made links to your CMMS are must-haves. That’s why many teams turn to eWorkOrders—it delivers CMMS GIS integration right out of the gate. We’ll see how this translates into real-world business success. eWorkOrders has earned high cybersecurity ratings for its commitment to protecting customer data—see our latest scorecard.Step 4: System Configuration & Integration
Start with a few essential layers—major utilities, critical equipment, key risk zones. Set role-based permissions so techs see their patch while executives view the big picture. Finally, plug in live sensor feeds or enterprise resource planning (ERP) data so that cost, condition, and location are displayed on one screen.Step 5: Pilot Project
Run a 60- to 90-day trial in a single building or utility zone—track metrics such as time-to-locate assets and first-time-fix rates. A tight pilot proves value quickly, builds internal champions, and uncovers snags before you scale.Step 6: Training & Change Management
Swap marathon classroom sessions for micro-lessons—15-minute map drills, QR-code practice in the field, or short how-to videos. Invite technicians to tweak symbols and layers; adoption soars when the crew feels a sense of ownership. Celebrate early wins to maintain momentum.Step 7: Full Rollout & Continuous Improvement
Expand coverage—add secondary networks, indoor floor plans, or leased equipment. Schedule quarterly data audits to verify coordinates and update condition scores. Layer in predictive analytics to forecast failures and request budgets before assets break. Need a hand? Contact the eWorkOrders team. We’ve helped hundreds of organizations roll out GIS-backed asset management with confidence and clarity.Success Story: Major Zoo Boosts Safety and Efficiency with GIS-Powered CMMS
Managing a 125+ acre zoo with over 1.5 million annual visitors, 2,000 animals, and 50 buildings is no walk in the park. But thanks to eWorkOrders’ CMMS platform—with built-in GIS features—this large zoo streamlined its entire maintenance ecosystem. The result? Faster response times, improved team coordination, and a noticeable bump in safety and guest satisfaction.How they pulled it off:
-
- Mobile-first service requests – Staff across the zoo could report issues from anywhere, instantly triggering a work order.
-
- GIS-integrated asset tracking – Techs could pinpoint exact problem spots on the map, from broken exhibits to utility malfunctions.
-
- Instant access to manuals and repair logs – No more digging through binders. Technicians had everything they needed on-site, on-screen.
-
- One dashboard, full visibility – From ride inspections to habitat upkeep, the team had eyes on all moving parts—literally.